
Portfolio paper
Assessing the Frontier
How Toffel Capital is positioned for the next 24 months
- Author
- Isaac Toffel
- Published
- Length
- 17 pages in print
Data dates stated in the paper: weights from the September 25, 2026 snapshot [1]; Performance (data through Sep 25, 2026) [1]; closing prices, market capitalization, forward P/E, five-year beta, dividend yield and trailing revenue growth for all holdings, Sep 23, 2026 close [2]; the 10-year Treasury at its September 22 close of 4.96% [23]
Summary
My portfolio rests on one conclusion about the next two years: the AI buildout will reward the companies that already earn from it, well before the payoff is proven for everyone else.
Historical snapshot
My portfolio rests on one conclusion about the next two years: the AI buildout will reward the companies that already earn from it, well before the payoff is proven for everyone else. I own those businesses as the core of the book, while keeping the ones that depend on outside funding small, holding other exposures so that a single outcome cannot decide the result. At today’s prices I expect about 16% over two years from this construction, against about 11% for the S&P 500, with a deeper loss if AI spending stalls while rates stay high. This paper sets out the market view behind the book, tests what current prices already assume, and names the places where my own positioning cuts against my thesis.
Executive summary
The view rests on five claims, each developed in Part I:
- The AI cycle is shifting from building capacity to earning on it.
- Scarce inputs set the pace of the buildout, and power stays scarce longer than compute.
- AI agents will change how software and commerce are priced.
- The cost of capital has risen, and it limits how much of the buildout can be funded.
- Policy is now a pricing input, and I position around it.
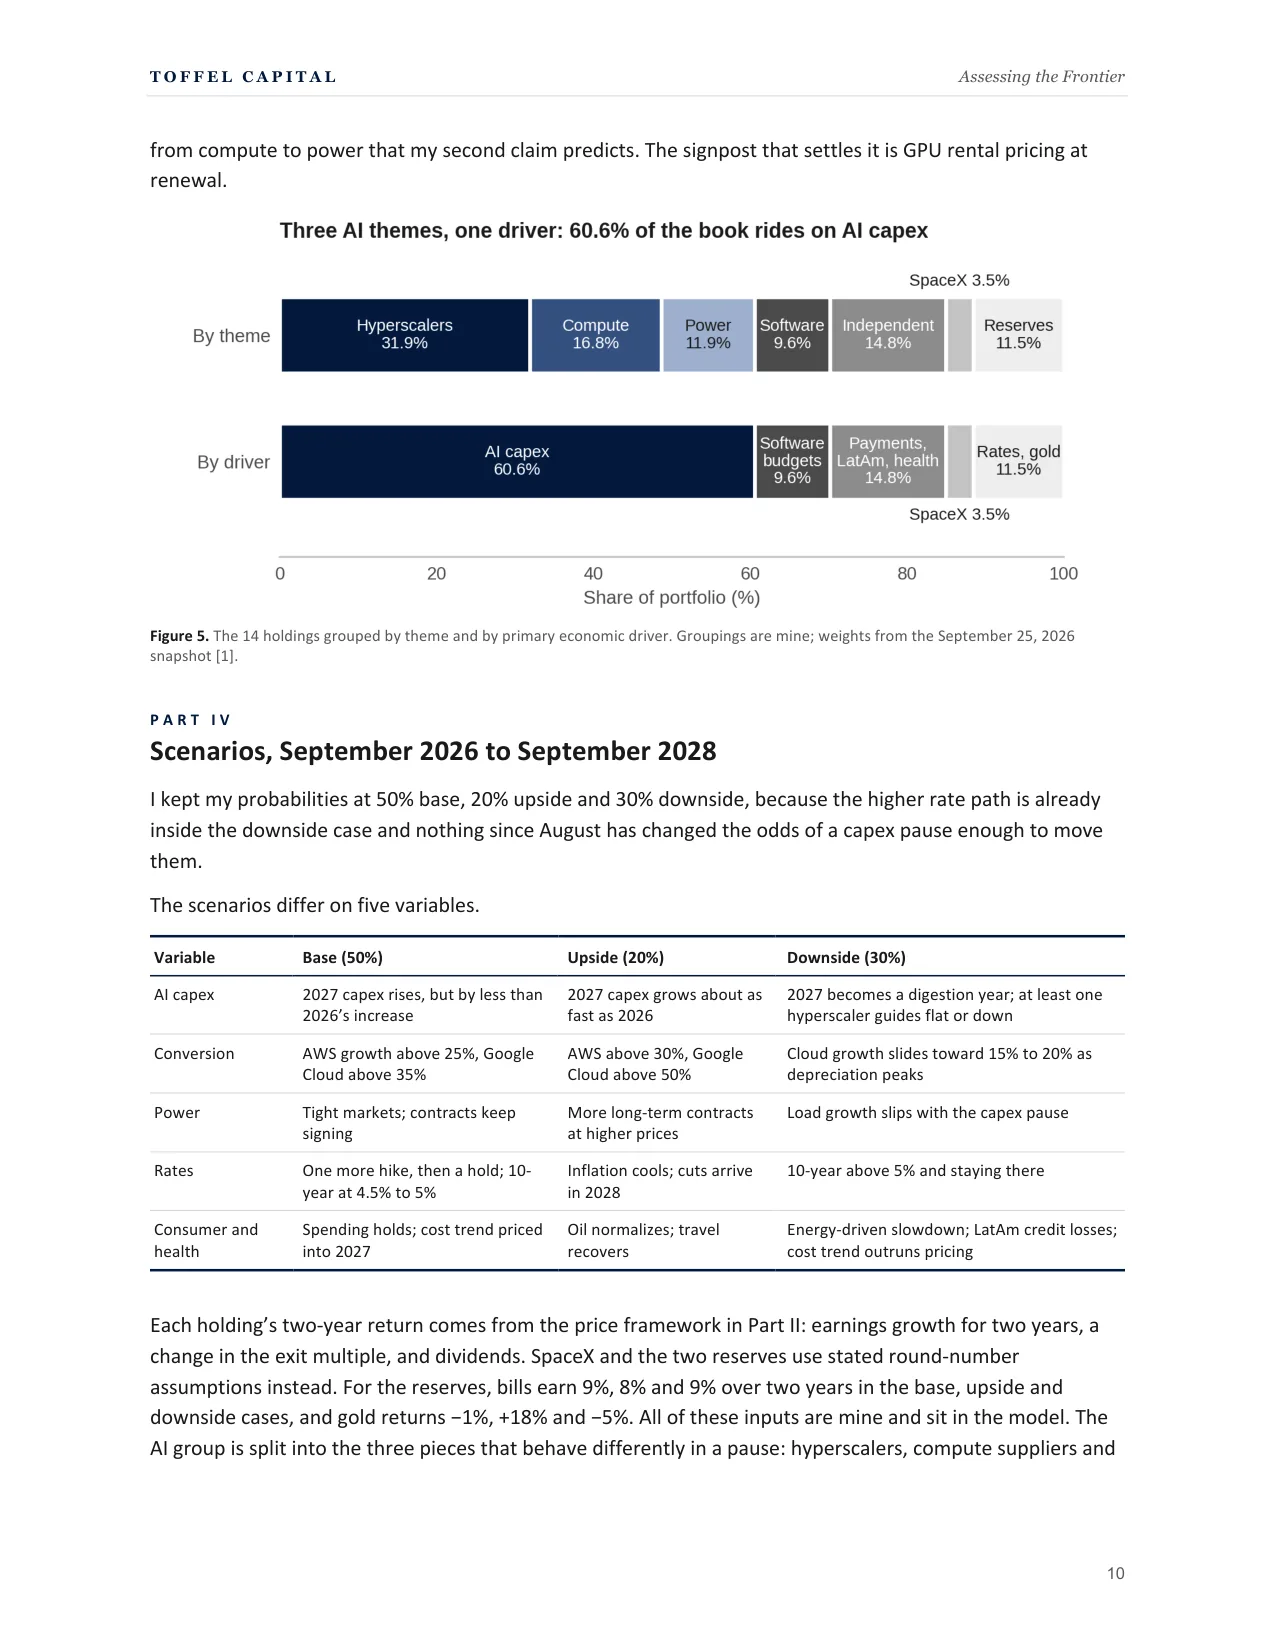
About 61% of the book sits in companies whose earnings depend on AI spending: Amazon, Alphabet and Meta (31.9%), the SMH semiconductor basket and Nebius (16.8%), and the generators Constellation and Vistra (11.9%). ServiceNow (9.6%) is my position in the application layer. Mastercard, MercadoLibre and UnitedHealth (14.8%) run on payment volume, Latin American commerce and medical costs. SpaceX (3.5%) is my space position, and it carries some AI exposure of its own. SGOV and GLDM (11.5%) hold Treasury bills and gold.
Across my three scenarios, weighted 50% base, 20% upside and 30% downside, the expected two-year return is 16.5%, against 10.7% for SPY and 11.5% for QQQ. The downside case, a pause in AI capex while rates stay high, costs 23.3% over two years, 5.7 points more than SPY. An instant version of the same shock would cost closer to 27%, and a replay of 2022 at today’s weights about 32%. The expected return assumes the 10-year settles back between 4.5% and 5%. If it stays near its September high, my own grid puts it closer to 15%.
Five position decisions follow. I am keeping Meta at about 12%, above my 11.5% soft ceiling, because the market prices its AI spending as a cost and I believe Muse will turn it into revenue. I am keeping Nebius at about 7%, knowing it accounts for more than a fifth of the portfolio’s downside. I hold SGOV at about 6% with a rule: half deploys if QQQ falls 10% from its high and half at 20%, and I will buy individual setups in between. I am keeping MercadoLibre at about 5% despite a demanding price, because I think its margins recover and I want the Latin American exposure. Additionally, I sold Rocket Lab and AST SpaceMobile and put most of the proceeds into SpaceX. My own post-mortem showed the two traded on one driver, sentiment toward pre-profit space companies, so I consolidated that exposure into the company that leads the industry in both launch and satellite broadband.
Part I
Where markets are heading
1. From building capacity to earning on it
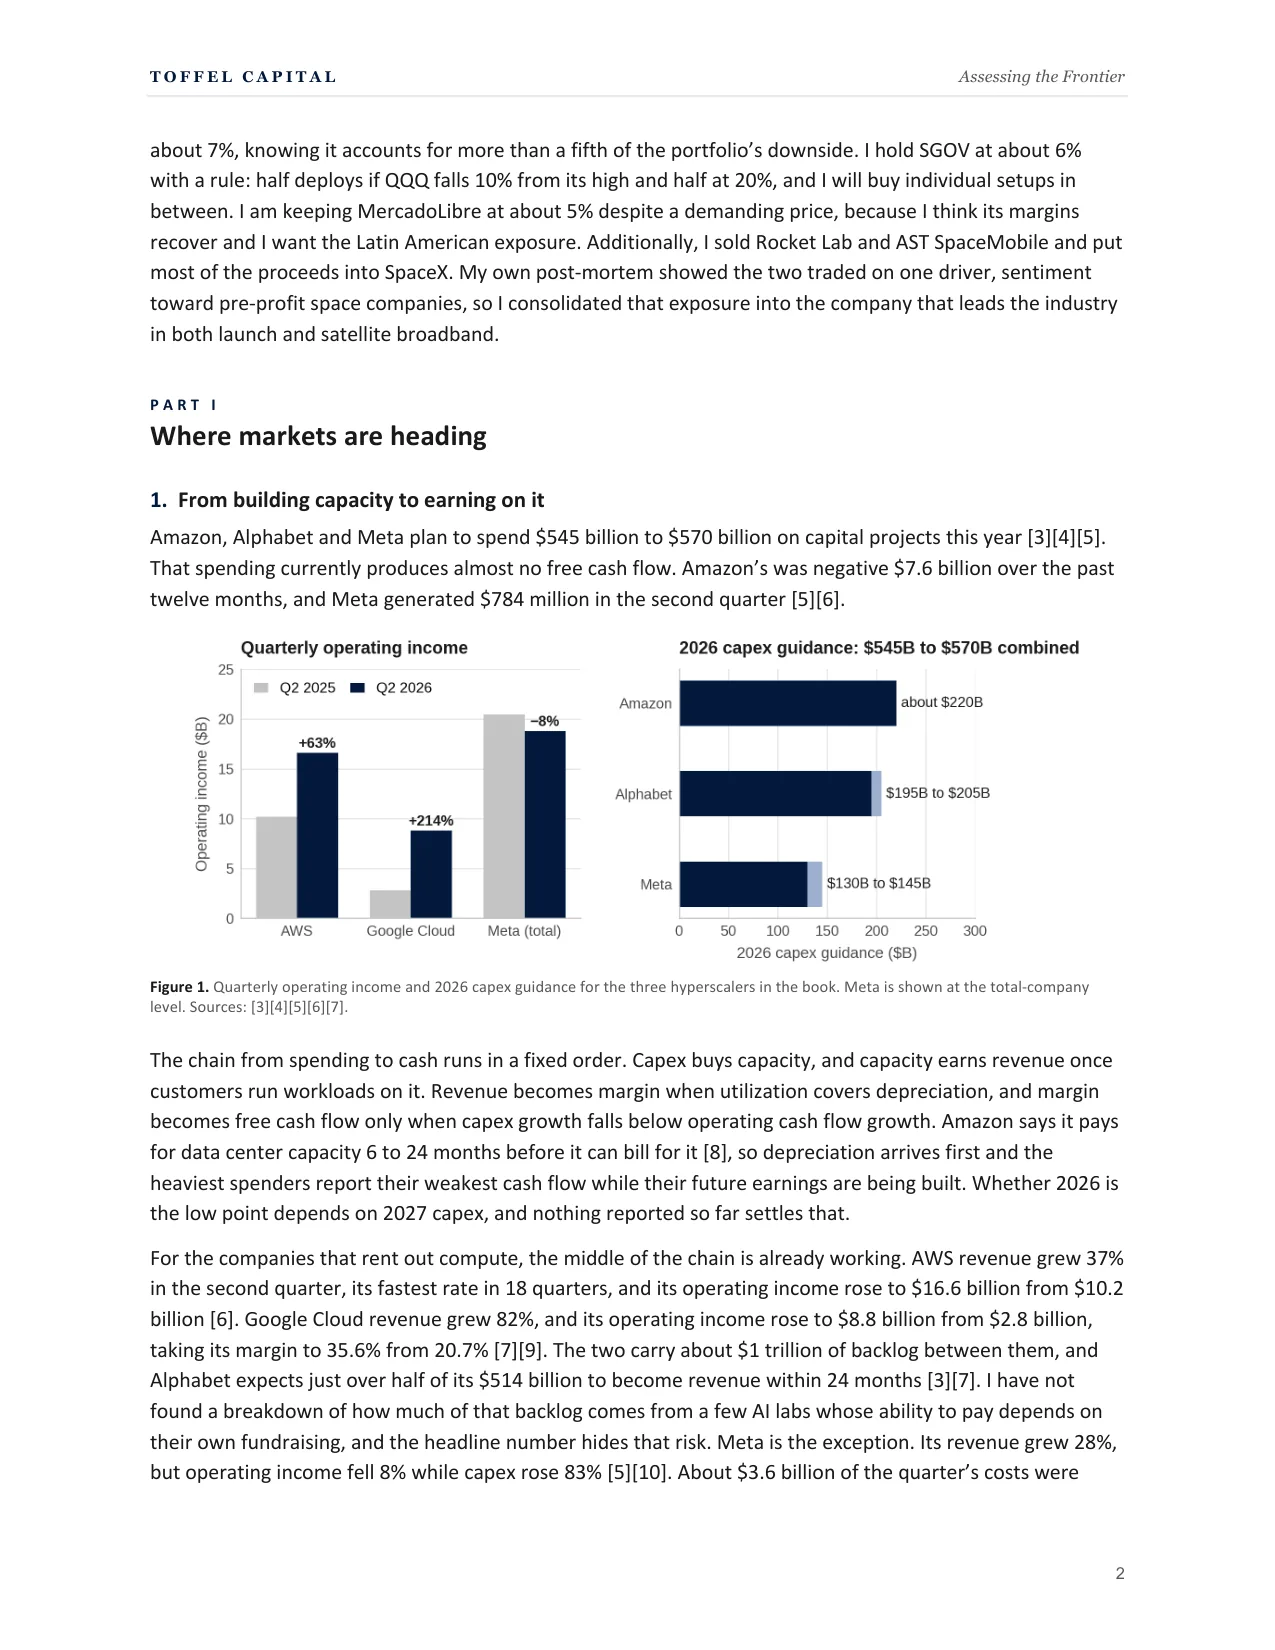
Amazon, Alphabet and Meta plan to spend $545 billion to $570 billion on capital projects this year [3][4][5]. That spending currently produces almost no free cash flow. Amazon’s was negative $7.6 billion over the past twelve months, and Meta generated $784 million in the second quarter [5][6].
Two-panel chart. Left panel, titled “Quarterly operating income”: grouped bars comparing Q2 2025 and Q2 2026 operating income ($B, axis 0 to 25) for AWS (labelled +63%), Google Cloud (labelled +214%) and Meta (total) (labelled −8%). Right panel, titled “2026 capex guidance: $545B to $570B combined”: horizontal bars of 2026 capex guidance ($B, axis 0 to 300) for Amazon (about $220B), Alphabet ($195B to $205B) and Meta ($130B to $145B), with each range drawn as a lighter extension of the bar.
Show page 2 of the PDF, where this figure appears
The chain from spending to cash runs in a fixed order. Capex buys capacity, and capacity earns revenue once customers run workloads on it. Revenue becomes margin when utilization covers depreciation, and margin becomes free cash flow only when capex growth falls below operating cash flow growth. Amazon says it pays for data center capacity 6 to 24 months before it can bill for it [8], so depreciation arrives first and the heaviest spenders report their weakest cash flow while their future earnings are being built. Whether 2026 is the low point depends on 2027 capex, and nothing reported so far settles that.
For the companies that rent out compute, the middle of the chain is already working. AWS revenue grew 37% in the second quarter, its fastest rate in 18 quarters, and its operating income rose to $16.6 billion from $10.2 billion [6]. Google Cloud revenue grew 82%, and its operating income rose to $8.8 billion from $2.8 billion, taking its margin to 35.6% from 20.7% [7][9]. The two carry about $1 trillion of backlog between them, and Alphabet expects just over half of its $514 billion to become revenue within 24 months [3][7]. I have not found a breakdown of how much of that backlog comes from a few AI labs whose ability to pay depends on their own fundraising, and the headline number hides that risk. Meta is the exception. Its revenue grew 28%, but operating income fell 8% while capex rose 83% [5][10]. About $3.6 billion of the quarter’s costs were legal charges and severance [5]. Without them, operating income would have risen about 9%, but costs would still have grown 42% against 28% revenue growth, so the squeeze is real.
I am wrong about this claim if combined 2027 capex guidance rises again while cloud growth slows.
2. Scarce inputs set the pace
Whoever owns the scarce input earns an excess return while the constraint binds, and I expect compute to stop binding before power does.
Compute is still short. Amazon says it will not have enough capacity to meet demand this year and likely next [3], and higher memory costs added about $20 billion to its capex plan [3]. Nebius customers now prepay 50% to 60% of the capex on new contracts [11], and Nebius raised on-demand GPU prices by 17% to 21% from October 1, its second increase in three months [12]. Chips, memory and GPU clouds can all add supply within a year or two, though, and I expect rental prices to feel that by 2028.
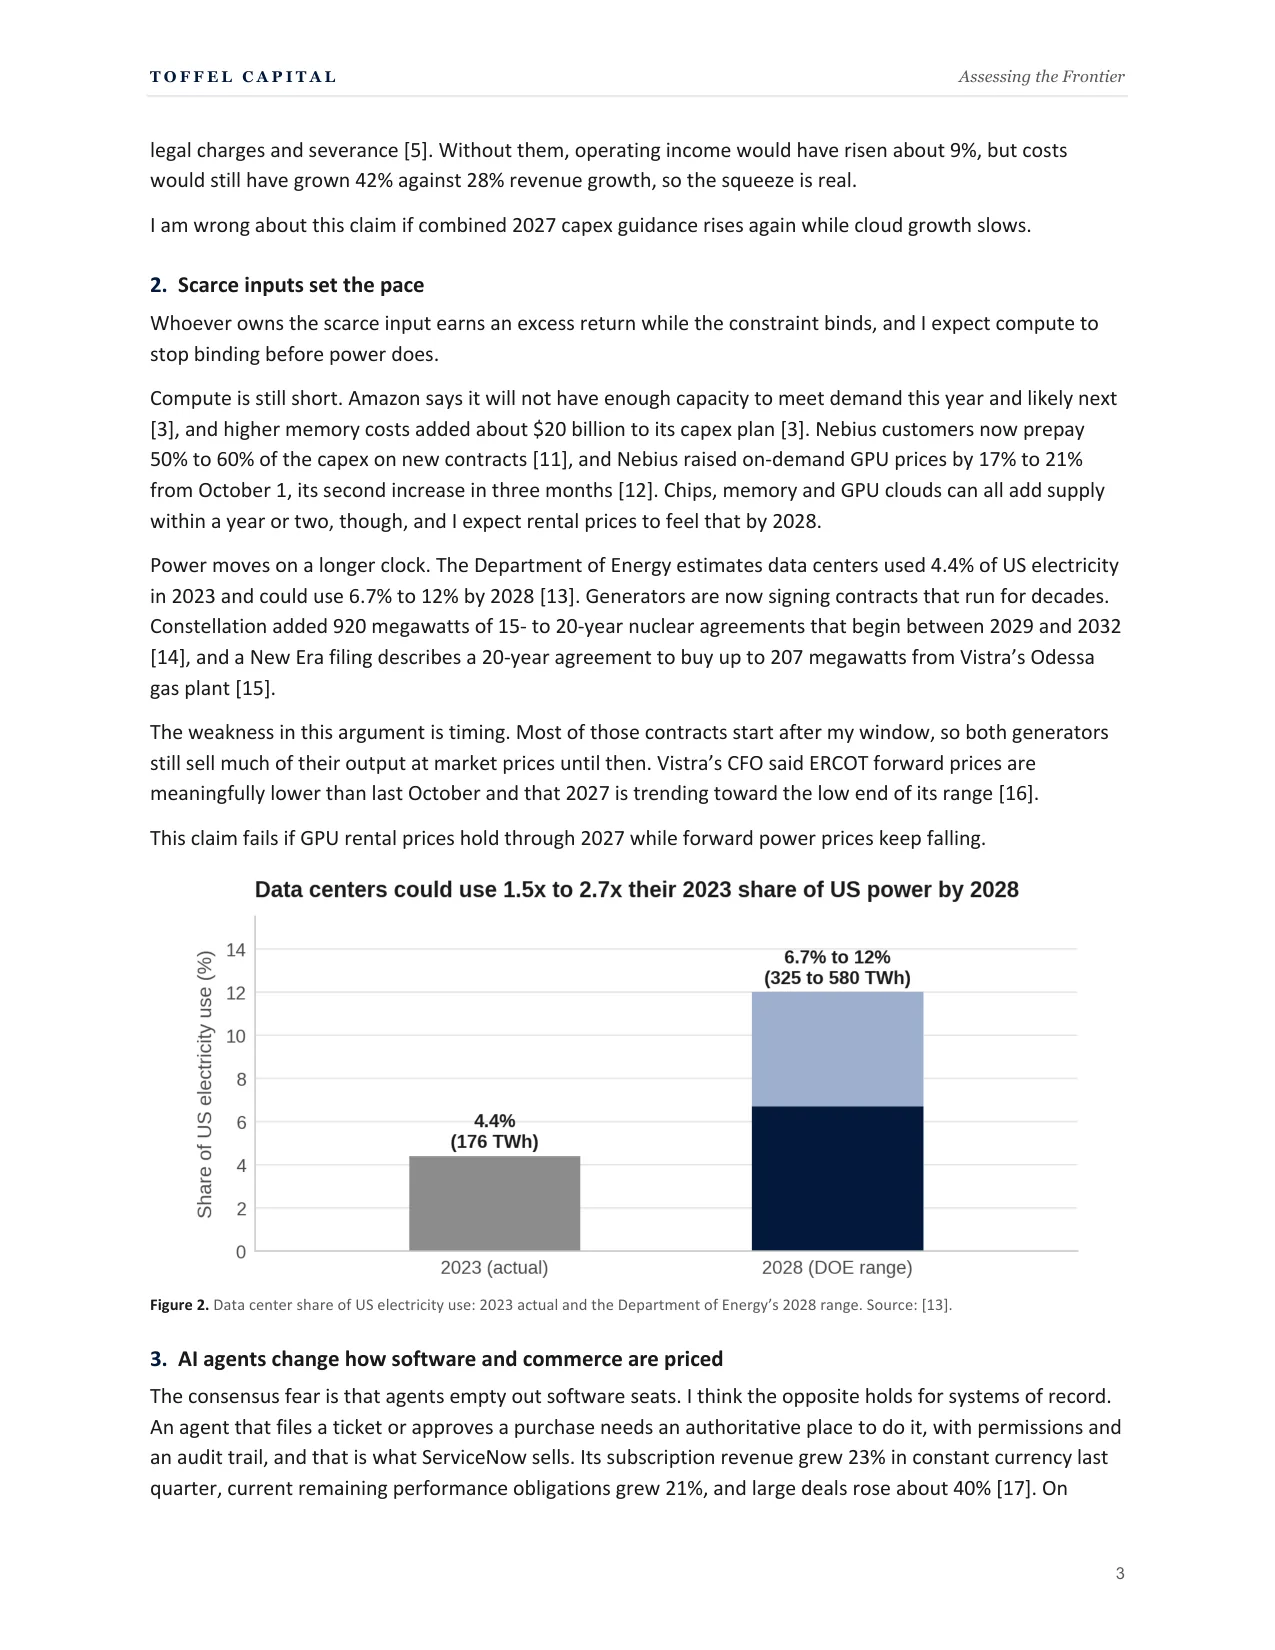
Power moves on a longer clock. The Department of Energy estimates data centers used 4.4% of US electricity in 2023 and could use 6.7% to 12% by 2028 [13]. Generators are now signing contracts that run for decades. Constellation added 920 megawatts of 15- to 20-year nuclear agreements that begin between 2029 and 2032 [14], and a New Era filing describes a 20-year agreement to buy up to 207 megawatts from Vistra’s Odessa gas plant [15].
The weakness in this argument is timing. Most of those contracts start after my window, so both generators still sell much of their output at market prices until then. Vistra’s CFO said ERCOT forward prices are meaningfully lower than last October and that 2027 is trending toward the low end of its range [16].
This claim fails if GPU rental prices hold through 2027 while forward power prices keep falling.
Bar chart titled “Data centers could use 1.5x to 2.7x their 2023 share of US power by 2028”. Y-axis: Share of US electricity use (%), 0 to 14. Bar for 2023 (actual) labelled 4.4% (176 TWh). Bar for 2028 (DOE range) labelled 6.7% to 12% (325 to 580 TWh), drawn as a dark segment up to 6.7% topped by a lighter segment up to 12%.
Show page 3 of the PDF, where this figure appears
3. AI agents change how software and commerce are priced
The consensus fear is that agents empty out software seats. I think the opposite holds for systems of record. An agent that files a ticket or approves a purchase needs an authoritative place to do it, with permissions and an audit trail, and that is what ServiceNow sells. Its subscription revenue grew 23% in constant currency last quarter, current remaining performance obligations grew 21%, and large deals rose about 40% [17]. On September 14, when AI-leader comments sent chip stocks down, software stocks rose [18]. The market treated software as a different bet from chips, and that is how I size it.
The pricing model is where the risk sits. Management said its gross margin guidance reflects customers running more workloads through hyperscaler partnerships and faster AI adoption [17]. ServiceNow now pays for compute to deliver agent features, so a move toward usage-based pricing could lift revenue while it lowers margins.
Commerce is changing in parallel. Meta’s Muse agent reached about 2.5 million downloads in its first 13 days after launching on September 8 [19]. That is small next to Meta’s 3.60 billion daily users [5], so it measures curiosity more than adoption. On September 21 Amazon blocked it from its store [20]. When a retailer blocks an agent that shops on behalf of users, it is protecting its control of the customer relationship, and that is the value Meta is trying to capture. The block is also a distribution problem, because it shuts Muse out of one of the places it would most want to shop.
The test for this claim is ServiceNow. If its organic growth falls below 16% while its gross margin keeps falling, I’d view this portion of the thesis as wrong.
4. The cost of capital has risen
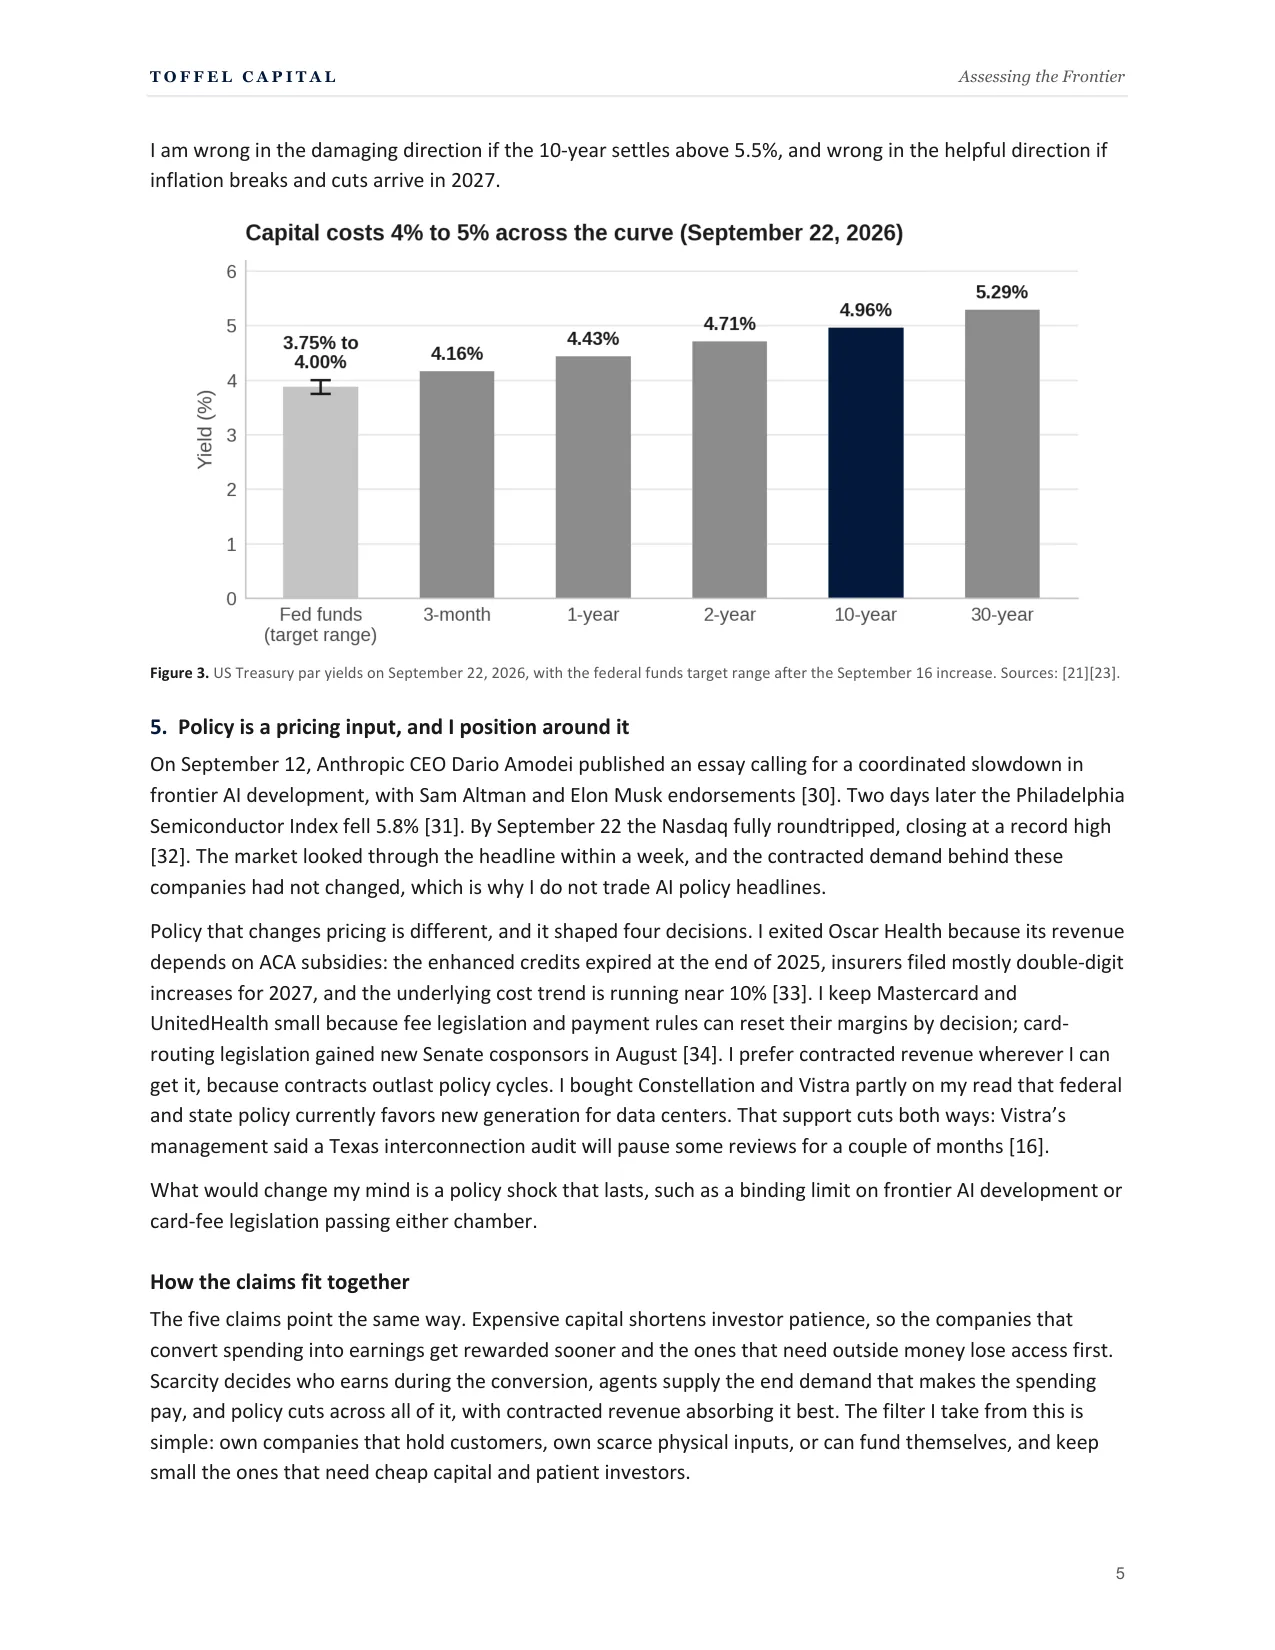
On September 16 the Fed raised its target range by a quarter point to 3.75% to 4.00%, its first increase since July 2023 [21]. The 10-year Treasury reached 5.041% during trading on September 15 [22], closed at 4.96% on September 22 [23], and hit 5.135% on September 23, its highest level since July 2007 [24]. Asked why yields had risen, Chair Warsh named economic strength, geopolitics and competition for capital, including hyperscalers raising funding [21].
That last reason matters most for my book. The largest spenders now use capital markets too. Alphabet raised $49.6 billion of equity in June and set up a $40 billion at-the-market program [9]. Meta’s long-term debt reached $83.66 billion at June 30 [5], and Nebius closed about $5.75 billion of convertible notes in August [25]. When the biggest borrowers compete for capital, everyone else pays more for it.
Three consequences shape the portfolio. Companies with internal cash flow can still fund their plans at a higher hurdle rate, while builders that need outside money pay twice, through a higher cost of funds and a lower multiple on their equity. Cash earns a real return, if a thin one: 3-month bills yielded 4.16% on September 22 [23], against consumer price inflation of 3.4% over the year to August [26]. And gold has not hedged this regime. It set a record of $5,594.82 an ounce on January 29 [27], fell more than 12% intraday the next day [28], and GLDM closed September 23 about 23% below its 52-week high [2].
My base case is one more hike, then a hold, with the 10-year between 4.5% and 5% and no cuts before 2028. That is close to the Fed’s own median projections of 4.1% for the funds rate at the end of 2026 and 2027 and 3.9% at the end of 2028 [29]. The 10-year is already above the top of that range, and Part IV shows that it is the single biggest threat to my numbers.
I am wrong in the damaging direction if the 10-year settles above 5.5%, and wrong in the helpful direction if inflation breaks and cuts arrive in 2027.
Bar chart titled “Capital costs 4% to 5% across the curve (September 22, 2026)”. Y-axis: Yield (%), 0 to 6. Bars: Fed funds (target range) 3.75% to 4.00%, with a range marker; 3-month 4.16%; 1-year 4.43%; 2-year 4.71%; 10-year 4.96%, highlighted in a darker colour; 30-year 5.29%.
Show page 5 of the PDF, where this figure appears
5. Policy is a pricing input, and I position around it
On September 12, Anthropic CEO Dario Amodei published an essay calling for a coordinated slowdown in frontier AI development, with Sam Altman and Elon Musk endorsements [30]. Two days later the Philadelphia Semiconductor Index fell 5.8% [31]. By September 22 the Nasdaq fully roundtripped, closing at a record high [32]. The market looked through the headline within a week, and the contracted demand behind these companies had not changed, which is why I do not trade AI policy headlines.
Policy that changes pricing is different, and it shaped four decisions. I exited Oscar Health because its revenue depends on ACA subsidies: the enhanced credits expired at the end of 2025, insurers filed mostly double-digit increases for 2027, and the underlying cost trend is running near 10% [33]. I keep Mastercard and UnitedHealth small because fee legislation and payment rules can reset their margins by decision; card-routing legislation gained new Senate cosponsors in August [34]. I prefer contracted revenue wherever I can get it, because contracts outlast policy cycles. I bought Constellation and Vistra partly on my read that federal and state policy currently favors new generation for data centers. That support cuts both ways: Vistra’s management said a Texas interconnection audit will pause some reviews for a couple of months [16].
What would change my mind is a policy shock that lasts, such as a binding limit on frontier AI development or card-fee legislation passing either chamber.
How the claims fit together
The five claims point the same way. Expensive capital shortens investor patience, so the companies that convert spending into earnings get rewarded sooner and the ones that need outside money lose access first. Scarcity decides who earns during the conversion, agents supply the end demand that makes the spending pay, and policy cuts across all of it, with contracted revenue absorbing it best. The filter I take from this is simple: own companies that hold customers, own scarce physical inputs, or can fund themselves, and keep small the ones that need cheap capital and patient investors.
Part II
What’s priced in
I asked one question of every stock in the book: what growth does today’s price already require? For the nine companies with meaningful earnings, I took the consensus forward P/E [2] and solved for the ten-year earnings growth rate that justifies it. The discount rate is each stock’s cost of equity: the 10-year Treasury at its September 22 close of 4.96% [23], a 5% equity risk premium, and its five-year beta [2], with 3% growth after year ten. For Nebius and SpaceX, which have little or no earnings, I solved for the ten-year revenue growth needed if free cash flow margins ramp from zero today to 25% and 30%. Those terminal margins are my assumptions, and so is a beta of 1.5 for SpaceX, which has traded only since June. Nebius’s five-year beta is weak evidence too, because its shares did not trade from early 2022 to late 2024, so its bar is probably understated. The model also assumes earnings turn fully into cash, which is generous to the hyperscalers today, so their real hurdle is higher than the table shows.
Here is what each price requires, next to what the business is doing now.
| Holding | Weight | Forward P/E | Growth the price requires (10 yr) | What the business is doing now | Verdict |
|---|---|---|---|---|---|
| META | 12.22% | 23.1x | 13% earnings | Revenue +28% in Q2; free cash flow $0.8B [5] | Fair |
| GOOGL | 10.05% | 25.2x | 14% earnings | Cloud operating income tripled; equity raised in June [9] | Fair |
| AMZN | 9.65% | 27.1x | 18% earnings | AWS operating income +63%; trailing free cash flow −$7.6B [6] | Rich vs. peers |
| NOW | 9.64% | 31.1x | 14% earnings | Subscription revenue +23% in constant currency [17] | Fair |
| VST | 6.39% | 13.4x | 6% earnings | 2027 trending to the low end of its range [16] | Cheap, but levered |
| CEG | 5.48% | 21.3x | 11% earnings | 920 MW of new long-term contracts [14] | Fair |
| MELI | 5.22% | 42.7x | 24% earnings | Revenue +50% in Q2 at a 6.7% operating margin [35] | Rich |
| MA | 5.06% | 26.3x | 9% earnings | Cross-border volume +12% in Q2 [36] | Fair to cheap |
| UNH | 4.48% | 17.5x | 1% earnings | Medical care ratio 86.7% vs. 89.4% [37] | Cheap if 2027 pricing holds |
| NBIS | 6.70% | n/m | 45% revenue | 2026 revenue guide $3.0B to $3.4B [38] | Priced for years of scarcity |
| SPCX | 3.53% | 102.5x | 53% revenue | Revenue +122% over twelve months; net loss $8.9B [39] | Priced for extraordinary growth |
| SMH | 10.08% | 37.0x trailing | 23% earnings (trailing) | Nvidia, about 19% of the fund, grew revenue 106% last quarter [40] | Priced for a long cycle |
Moving the equity risk premium between 4.5% and 5.5% shifts each required growth rate by about 1.5 points either way without changing the ranking. Using the 5.135% the 10-year touched on September 23 instead would add about half a point to each. Three comparisons are missing because I could not source them at one standard: each company’s five-year median multiple, peer medians, and consensus revenue and free cash flow.
Grouped bar chart titled “What each price requires, from cheapest to most demanding”. Y-axis: Annual growth (%), 0 to 50. For each of UNH, VST, MA, CEG, META, GOOGL, NOW, AMZN and MELI, three bars: Growth the price requires (10-yr earnings), My base case (2-yr earnings) and Trailing 12-month revenue growth. The bars carry no value labels.
Show page 7 of the PDF, where this figure appears
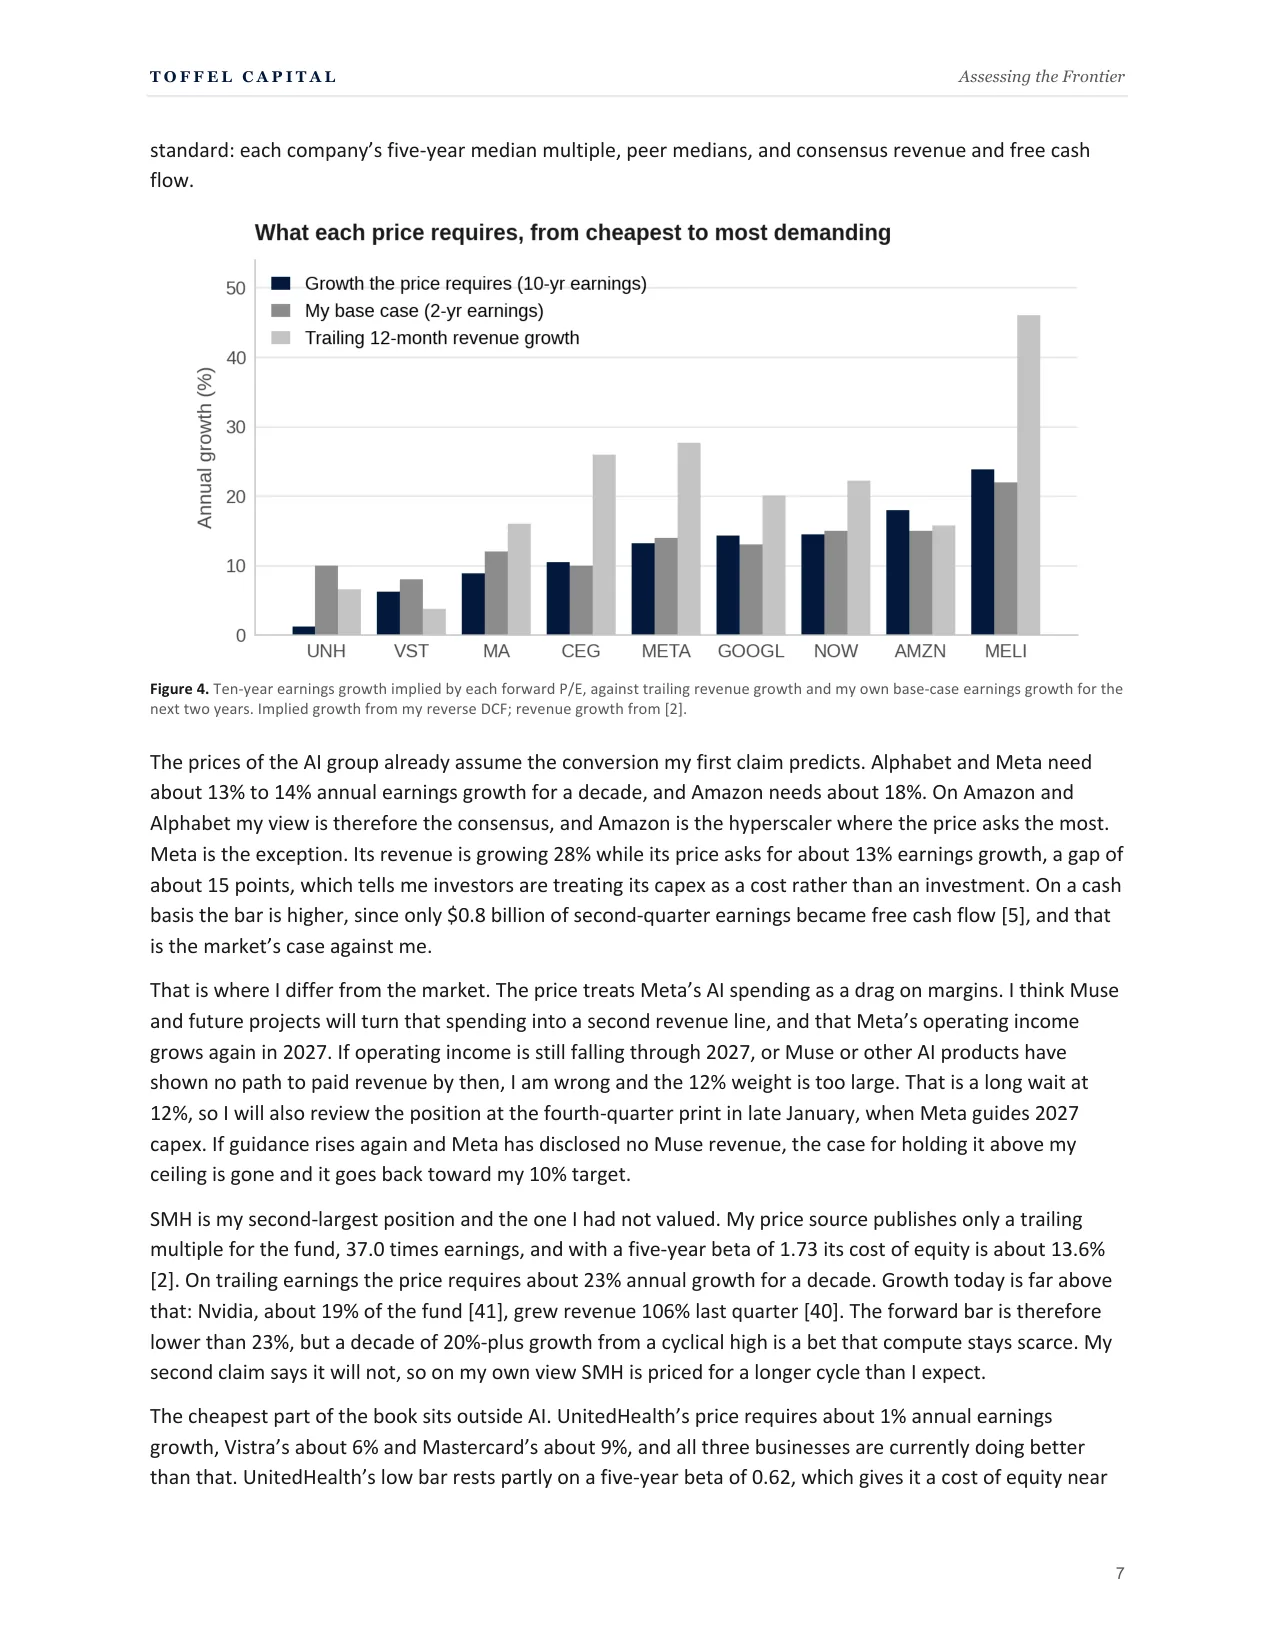
The prices of the AI group already assume the conversion my first claim predicts. Alphabet and Meta need about 13% to 14% annual earnings growth for a decade, and Amazon needs about 18%. On Amazon and Alphabet my view is therefore the consensus, and Amazon is the hyperscaler where the price asks the most. Meta is the exception. Its revenue is growing 28% while its price asks for about 13% earnings growth, a gap of about 15 points, which tells me investors are treating its capex as a cost rather than an investment. On a cash basis the bar is higher, since only $0.8 billion of second-quarter earnings became free cash flow [5], and that is the market’s case against me.
That is where I differ from the market. The price treats Meta’s AI spending as a drag on margins. I think Muse and future projects will turn that spending into a second revenue line, and that Meta’s operating income grows again in 2027. If operating income is still falling through 2027, or Muse or other AI products have shown no path to paid revenue by then, I am wrong and the 12% weight is too large. That is a long wait at 12%, so I will also review the position at the fourth-quarter print in late January, when Meta guides 2027 capex. If guidance rises again and Meta has disclosed no Muse revenue, the case for holding it above my ceiling is gone and it goes back toward my 10% target.
SMH is my second-largest position and the one I had not valued. My price source publishes only a trailing multiple for the fund, 37.0 times earnings, and with a five-year beta of 1.73 its cost of equity is about 13.6% [2]. On trailing earnings the price requires about 23% annual growth for a decade. Growth today is far above that: Nvidia, about 19% of the fund [41], grew revenue 106% last quarter [40]. The forward bar is therefore lower than 23%, but a decade of 20%-plus growth from a cyclical high is a bet that compute stays scarce. My second claim says it will not, so on my own view SMH is priced for a longer cycle than I expect.
The cheapest part of the book sits outside AI. UnitedHealth’s price requires about 1% annual earnings growth, Vistra’s about 6% and Mastercard’s about 9%, and all three businesses are currently doing better than that. UnitedHealth’s low bar rests partly on a five-year beta of 0.62, which gives it a cost of equity near 8% and misses the company-specific risk that hit the stock in 2025, so I read it as cheap only if 2027 pricing holds. MercadoLibre is the exception, and the clearest case of a good company at a demanding price. It needs about 24% earnings growth for a decade while its operating margin has fallen to 6.7%, because it is spending on shipping, credit and first-party inventory.
I am keeping it at about 5% anyway. I think the margin compression is a choice rather than a structural problem, and that margins recover once that spending matures. I also want Latin American exposure in the book, and MercadoLibre is the best way I know to own the region’s growth in commerce and credit. That exposure diversifies what drives my returns. It does little to limit how far they fall in a sell-off: MercadoLibre dropped 37% in 2022, more than the Nasdaq-100 [42]. If its operating margin has not stabilized and started rising by mid-2027, the margin case is wrong and the position gets reviewed.
The speculative names are priced as if they work. Nebius needs about 45% annual revenue growth for ten years, reaching roughly $55 billion. Even if it hits its guide of $7 billion to $9 billion of run-rate revenue by year-end [38], it still needs more than 20% a year for the rest of the decade. My thesis is already in that price, with no margin of safety. My own reason for keeping Nebius smaller than the hyperscalers is that it would be the first thing to break if the shortage ended, when hyperscalers with cheaper financing could undercut independent GPU clouds on price. The valuation agrees. SpaceX is priced for more than any other holding. Its forward P/E is 102.5x [39], and the price needs about 53% annual revenue growth for ten years, reaching roughly $1.6 trillion, about twice Amazon’s revenue today [2]. Rocket Lab and AST SpaceMobile, which I sold to buy it, required 55% to 77%, so the swap replaced two expensive options with one expensive leader rather than lowering the bar. I did not make the trade because SpaceX is cheap. I made it to hold one space position instead of two that moved together, in a company with a large operating business and a net cash balance behind it. The new position is about three-quarters of the old combined weight, so I carry somewhat less valuation risk in space than before.
Part III
How the book is positioned
| Claim | Holdings and weight | Why this size | Where the book cuts against the claim |
|---|---|---|---|
| 1. Building to earning | AMZN 9.65%, GOOGL 10.05%, META 12.22% (31.92%) | Largest group because they already earn on the build | Meta is the largest single holding and the one hyperscaler not yet converting |
| 2. Scarce inputs | SMH 10.08%, NBIS 6.70% (16.78%); CEG 5.48%, VST 6.39% (11.87%) | Compute and power both earn while supply is short | Compute outweighs power, although the claim says power stays scarce longer |
| 3. Agents reprice software | NOW 9.64% | One position in the layer agents must run through | Rests on one company whose gross margin is falling |
| 4. Cost of capital | SGOV 5.96%, GLDM 5.54%; NBIS kept small (6.70%) | Cash earns a real return; the outside-funded builder sized for failure | Gold has not hedged this rate regime |
| 5. Policy | MA 5.06%, UNH 4.48%; Oscar exited; CEG and VST | Small where rules set margins; contracted revenue preferred | MELI 5.22% carries Latin American policy and currency risk |
| Space (outside the five claims) | SPCX 3.53% | About three-quarters of the two positions it replaced | Adds AI exposure through its AI segment; priced for extraordinary growth |
The positions table adds the valuation read from Part II and the signpost for each holding.
| Holding | Weight | Role | Forward P/E | Verdict | What I am watching |
|---|---|---|---|---|---|
| META | 12.22% | Hyperscaler | 23.1x | Fair | Operating income growth in 2027 |
| SMH | 10.08% | Compute supplier | 37.0x trailing | Priced for a long cycle | Combined 2027 capex guidance |
| GOOGL | 10.05% | Hyperscaler | 25.2x | Fair | Cloud growth vs. capex growth |
| AMZN | 9.65% | Hyperscaler | 27.1x | Rich vs. peers | AWS growth vs. capex growth |
| NOW | 9.64% | Application layer | 31.1x | Fair | Organic growth at or above 16% |
| NBIS | 6.70% | Compute supplier | n/m | Priced for scarcity | Year-end run-rate revenue of at least $7B |
| VST | 6.39% | Power | 13.4x | Cheap, levered | 2027 results vs. range |
| SGOV | 5.96% | Reserve | n/a | n/a | QQQ drawdown of 10% and 20% |
| GLDM | 5.54% | Reserve | n/a | n/a | Behavior in the next equity drawdown |
| CEG | 5.48% | Power | 21.3x | Fair | New long-term contracts |
| MELI | 5.22% | Independent | 42.7x | Rich | Operating margin trend |
| MA | 5.06% | Independent | 26.3x | Fair to cheap | Cross-border volume; fee legislation |
| UNH | 4.48% | Independent | 17.5x | Cheap if 2027 pricing holds | Medical care ratio vs. 2027 pricing |
| SPCX | 3.53% | Space and AI | 102.5x | Priced for extraordinary growth | Starlink growth; Starship milestones |
The construction follows the order in which the AI build pays. Suppliers of chips and power are paid first, as the capex is spent. The hyperscalers are paid next, as capacity earns. Applications like ServiceNow are paid last, if agents create lasting value. I hold all three stages so that the book does not depend on guessing which one captures the most.
Funding source is the second sorting rule. The hyperscalers can still fund their plans mostly from operations, even though Alphabet and Meta now tap capital markets as well. Nebius is the one holding that needs outside capital or customer prepayments to grow, so it is sized below every core holding. SpaceX burns cash as well, but it held about $60 billion of net cash at its last report after raising $75 billion in its June IPO [39][43].
Four tensions in the book need a decision rather than an explanation. Meta is my largest holding, above my 11.5% soft ceiling, and the one hyperscaler whose spending has not yet converted; I have re-underwritten it at about 12% for the valuation reason in Part II. Nebius, which depends on outside funding, is larger than either generator, at 6.70% against 6.39% for Vistra and 5.48% for Constellation, even though my fourth claim says to keep builders like it small. SGOV is down to about 6% of the book from 8.81% when I opened it on August 17, after I sold about a third of it on September 3 to fund Vistra [44], so the reserve that is supposed to buy the next drawdown is smaller than it was, and the deployment rule matters more. And compute still outweighs power, 16.8% to 11.9%, so the book is positioned for scarcity to last more than for the rotation from compute to power that my second claim predicts. The signpost that settles it is GPU rental pricing at renewal.
Two stacked horizontal bars titled “Three AI themes, one driver: 60.6% of the book rides on AI capex”, on an axis of Share of portfolio (%) from 0 to 100. By theme: Hyperscalers 31.9%, Compute 16.8%, Power 11.9%, Software 9.6%, Independent 14.8%, SpaceX 3.5%, Reserves 11.5%. By driver: AI capex 60.6%, Software budgets 9.6%, Payments, LatAm, health 14.8%, SpaceX 3.5%, Rates, gold 11.5%.
Show page 10 of the PDF, where this figure appears
Part IV
Scenarios, September 2026 to September 2028
I kept my probabilities at 50% base, 20% upside and 30% downside, because the higher rate path is already inside the downside case and nothing since August has changed the odds of a capex pause enough to move them.
The scenarios differ on five variables.
| Variable | Base (50%) | Upside (20%) | Downside (30%) |
|---|---|---|---|
| AI capex | 2027 capex rises, but by less than 2026’s increase | 2027 capex grows about as fast as 2026 | 2027 becomes a digestion year; at least one hyperscaler guides flat or down |
| Conversion | AWS growth above 25%, Google Cloud above 35% | AWS above 30%, Google Cloud above 50% | Cloud growth slides toward 15% to 20% as depreciation peaks |
| Power | Tight markets; contracts keep signing | More long-term contracts at higher prices | Load growth slips with the capex pause |
| Rates | One more hike, then a hold; 10-year at 4.5% to 5% | Inflation cools; cuts arrive in 2028 | 10-year above 5% and staying there |
| Consumer and health | Spending holds; cost trend priced into 2027 | Oil normalizes; travel recovers | Energy-driven slowdown; LatAm credit losses; cost trend outruns pricing |
Each holding’s two-year return comes from the price framework in Part II: earnings growth for two years, a change in the exit multiple, and dividends. SpaceX and the two reserves use stated round-number assumptions instead. For the reserves, bills earn 9%, 8% and 9% over two years in the base, upside and downside cases, and gold returns −1%, +18% and −5%. All of these inputs are mine and sit in the model. The AI group is split into the three pieces that behave differently in a pause: hyperscalers, compute suppliers and power. The last two columns give each group’s probability-weighted return and its share of the portfolio’s downside.
| Group | Weight | Base | Upside | Downside | Expected | Share of downside |
|---|---|---|---|---|---|---|
| Hyperscalers | 31.92% | +27% | +62% | −19% | +20.2% | 26.0% |
| Compute suppliers | 16.78% | +24% | +106% | −58% | +15.8% | 41.8% |
| Power | 11.87% | +23% | +52% | −21% | +15.6% | 10.7% |
| Software | 9.64% | +26% | +56% | −18% | +18.8% | 7.4% |
| Independent | 14.76% | +26% | +56% | −12% | +20.6% | 7.6% |
| Space (SpaceX) | 3.53% | +5% | +80% | −50% | +3.5% | 7.6% |
| Bills (SGOV) | 5.96% | +9% | +8% | +9% | +8.8% | −2.3% |
| Gold (GLDM) | 5.54% | −1% | +18% | −5% | +1.6% | 1.2% |
| Portfolio | 100.00% | +22.3% | +61.6% | −23.3% | +16.5% | 100.0% |
| SPY | +17.3% | +36.5% | −17.6% | +10.7% | ||
| QQQ | +20.8% | +52.4% | −31.1% | +11.5% |
The probability-weighted expected return is 16.5% over two years, against 10.7% for SPY and 11.5% for QQQ. That is 5.8 points of expected excess return over my primary benchmark. The cost is a deeper downside: in the bad case I lose 5.7 points more than SPY, though 7.8 points less than QQQ. The benchmark scenarios use the same structure of earnings growth, multiple change and dividends, with inputs I set.
Grouped bar chart titled “Scenario returns by group, with the portfolio and both benchmarks”. Y-axis: Two-year total return (%), −50 to 125. For each of Hyperscalers, Compute suppliers, Power, Software, Independent, SpaceX, Reserves, Portfolio, SPY and QQQ there are bars for Downside (30%), Base (50%) and Upside (20%); Portfolio, SPY and QQQ sit on a shaded background. Labelled downside values: Hyperscalers −19, Compute suppliers −58, Power −21, Software −18, Independent −12, SpaceX −50, Portfolio −23, SPY −18, QQQ −31; the Reserves downside bar is labelled 2.
Show page 11 of the PDF, where this figure appears
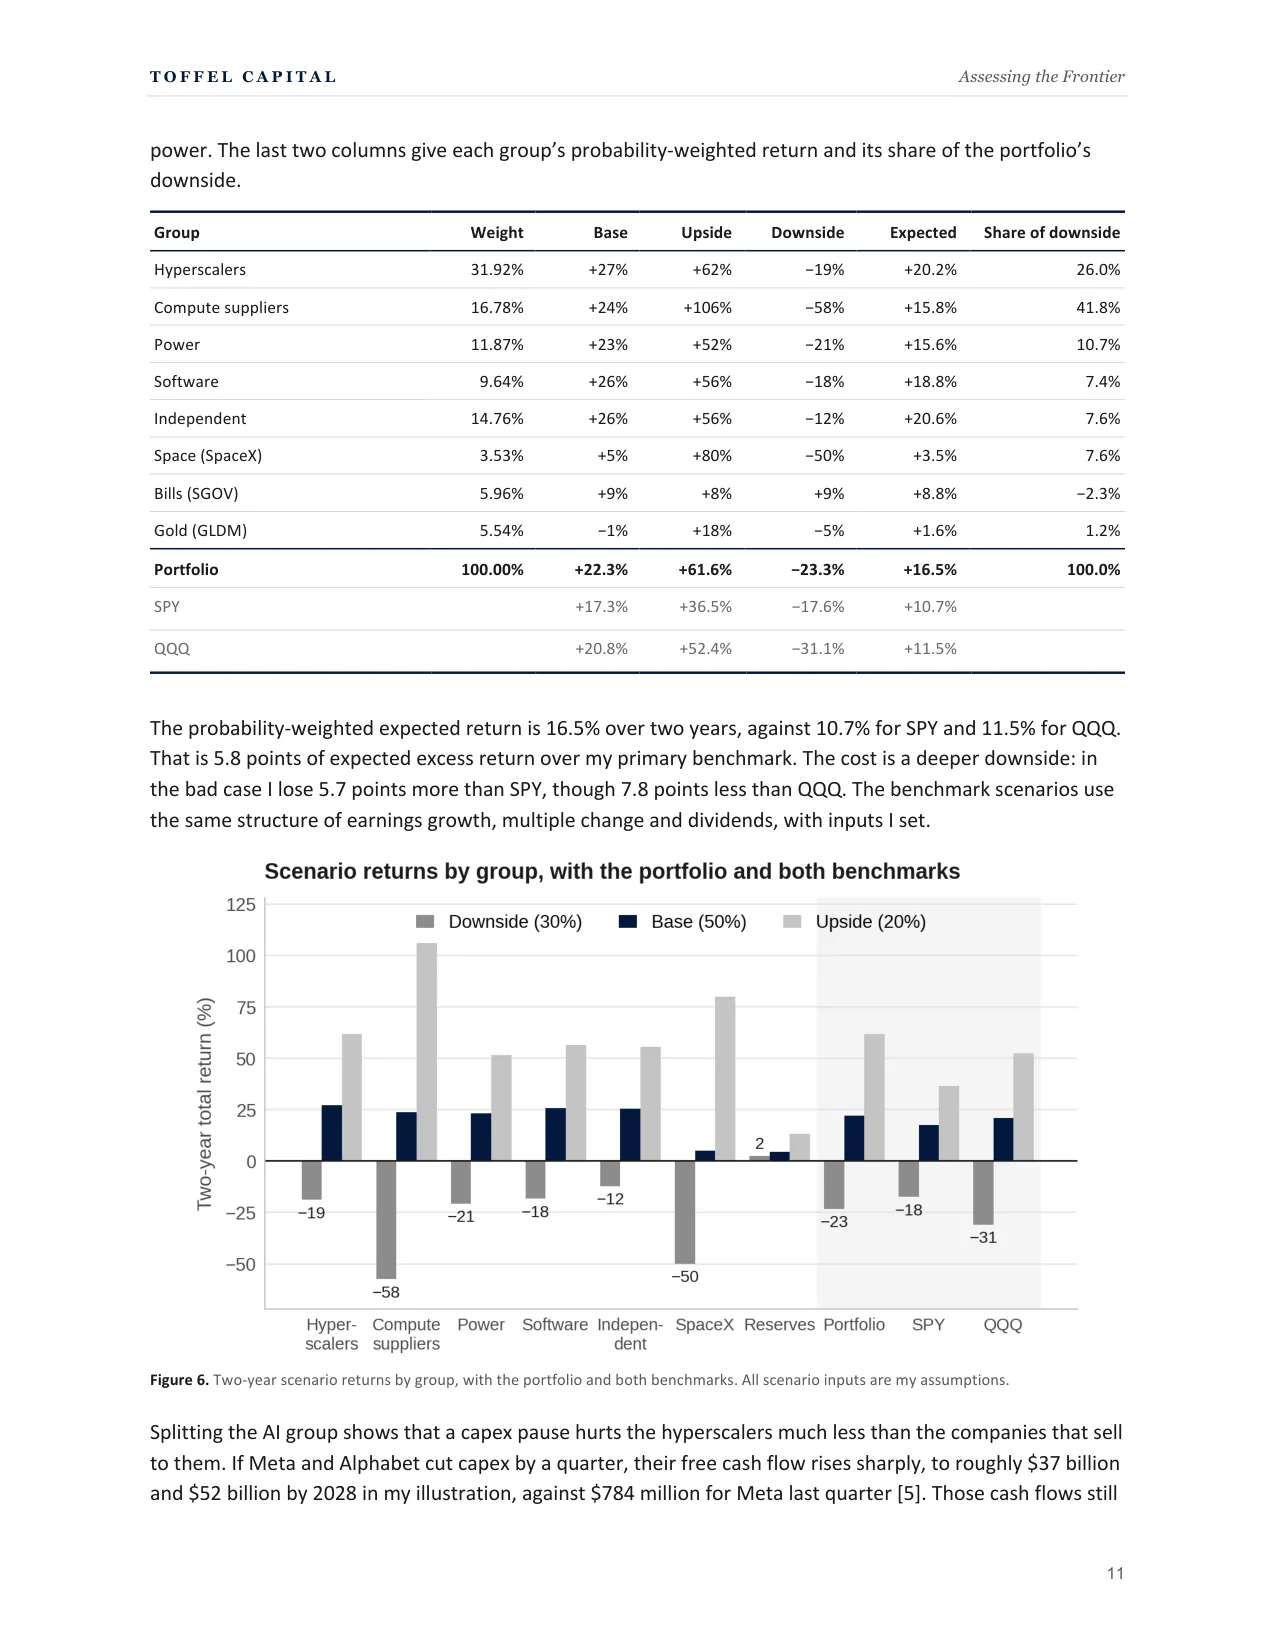
Splitting the AI group shows that a capex pause hurts the hyperscalers much less than the companies that sell to them. If Meta and Alphabet cut capex by a quarter, their free cash flow rises sharply, to roughly $37 billion and $52 billion by 2028 in my illustration, against $784 million for Meta last quarter [5]. Those cash flows still equal FCF yields of only 1.5% to 2.4% at the downside prices, below the 10-year Treasury, so the cash cushions the stocks without setting a floor. I have the hyperscalers falling about 19%. The suppliers get no cushion, because their revenue is the capex being cut: SMH falls about 46% and Nebius about 77%. Nebius alone accounts for more than a fifth of the portfolio’s downside, which is the cost of keeping it at its current size.
The last two columns show where the risk sits. Compute suppliers are 16.8% of the book but about 42% of its downside, and their expected return of 15.8% is below the hyperscalers’ 20.2%. On my own inputs, compute is where the book takes the most risk for the least expected return, apart from SpaceX, and it is the clearest place where my sizing runs ahead of my numbers.
Splitting the reserve shows the same problem on a smaller scale. On those inputs gold’s expected return is about 2%, against about 9% for bills, and it loses money in the downside case it is supposed to cushion. It pays only when inflation cools and rates fall, which is the case where the rest of the book already does best. The argument for keeping it has to rest on risks my three scenarios leave out, such as a dollar or geopolitical shock, and I have not yet shown that gold protects against either. On my own numbers it has the lowest expected return of anything I own.
The trades since August 20 helped slightly. Under the same assumptions, the August book had an expected return of 15.2% and a downside of −24.6%, against 16.5% and −23.3% now. Exiting Cerebras and Oscar removed two of the book’s worst tails, and Vistra added power exposure that holds up better in a pause. The SpaceX trade leaves the expected return about unchanged in my model and improves the downside by about 0.9 points, because SpaceX’s assumed tails are narrower than those of the two names it replaced and the new position is about a point smaller. My SpaceX inputs are plain round numbers, so that result is a check on the trade’s risk, not a forecast of its payoff. Taken literally, those inputs give SpaceX an expected return of 3.5%, less than bills would earn over the same two years, so on my own numbers I am holding it for the upside case.
An instant-shock version of the downside, which cuts the whole AI group by 35% at once, costs about 27%. The two-year downside of −23.3% is milder mainly because the hyperscalers fall 19% instead of 35% once the free cash flow effect is modeled, which adds 5.1 points, partly offset by deeper supplier losses, which cost 3.9 points. The two-year figure is an endpoint that includes two years of earnings, dividends and bill yield. The path to it can go lower. The instant shock puts a peak loss near −27%, and the 2022 replay in Part V puts it nearer −32%.
The largest sensitivity is the 10-year yield at the end of the window, and how much of a change in it reaches each stock’s cost of equity. Passing the full change through overstates the effect. Asked to explain 2022, my framework says the S&P 500’s forward P/E should have fallen from 21.3 to about 13 as the 10-year rose from 1.52% to 3.88%; it fell to 16.7 [45][46][47]. A pass-through of about 44% reproduces that, and the grid below uses it.
| 10-year yield at exit | Hyperscaler multiple −20% | −10% | Unchanged | +10% | +20% |
|---|---|---|---|---|---|
| 4.0% | 17.9% | 21.9% | 26.2% | 30.4% | 34.5% |
| 4.5% | 13.0% | 16.9% | 20.9% | 24.9% | 28.9% |
| 5.0% | 8.5% | 12.3% | 16.1% | 20.0% | 23.7% |
| 5.5% | 4.5% | 8.1% | 11.7% | 15.4% | 19.0% |
| 6.0% | 0.8% | 4.2% | 7.7% | 11.2% | 14.7% |
Each cell is the expected two-year portfolio return. With the hyperscaler multiple unchanged, the expected return is about 21% if the 10-year finishes at 4.5% and about 12% if it finishes at 5.5%. A 10% move in the hyperscaler multiple shifts it by about 4 points, so half a point on the 10-year still matters slightly more than any AI variable I tested.
My base case contains a rate call. It assumes the 10-year settles between 4.5% and 5%, and the 10-year is already above that range. If it ends the window near the 5.135% it touched on September 23, the grid implies an expected return of about 15%, not 16.5%.
Part V
Risks
The concentration sits in one driver. No single stock exceeds 12.3%, but 60.6% of the book, and 68.4% of the equity, depends on AI capex continuing at roughly the pace the hyperscalers guided. Using five-year betas [2], and an assumed 1.5 for SpaceX, the portfolio’s beta to the S&P 500 is 1.13 and the AI group’s is 1.38. The account’s realized beta since July 2025 is 1.68, and its worst drawdown so far was −21.53%, in March 2026 [1]. The two betas measure different things, since 1.13 applies long-run betas to today’s weights and 1.68 comes from the book I actually held, but the gap tells me the five-year figure probably understates how this book trades in a sell-off. SpaceX adds to the AI exposure beyond that 60.6%, because its AI segment develops the Grok models and builds large data centers [48].
My fourth claim is the one most hostile to my own book. Long-duration growth equities lose value as yields rise, so if I am right that capital stays expensive, the rest of the thesis has to work harder to deliver the returns in Part IV.
My track record rests on one position. Through September 25, my excess return over the S&P 500 since July 3, 2025 was 17.78 points, and it falls to 3.26 points without Nebius [1]. Roughly 80% of the excess comes from one name, and at a beta of 1.68 the book has only about matched what its risk alone would imply.
The independent sleeve diversifies less than its label suggests. Its beta is 0.91, but that average hides a split. Mastercard (0.74) and UnitedHealth (0.62) behave defensively, while MercadoLibre (1.31) behaves like a growth stock. In 2022, Mastercard returned −2.7% and MercadoLibre −37.2%, against −18.2% for SPY and −32.6% for QQQ [42]. Gold returned −0.5% that year [42], so it held its value in a growth and inflation scare, yet it has fallen with the rate shock in 2026. The table below replays the whole book through 2022.
The replay applies each holding’s 2022 total return to today’s weights [42]. Nebius did not trade in 2022 and SpaceX was private, so both take their downside-case inputs, −77% and −50%. Constellation traded only from its February 2022 spin-off, so it takes Vistra’s 2022 return.
| Group | Weight | 2022 return | Contribution |
|---|---|---|---|
| Hyperscalers | 31.92% | −51.9% | −16.6 |
| Compute suppliers | 16.78% | −50.9% | −8.5 |
| Power | 11.87% | +5.1% | +0.6 |
| Software | 9.64% | −40.2% | −3.9 |
| Independent | 14.76% | −12.0% | −1.8 |
| Space (SpaceX) | 3.53% | −50.0% | −1.8 |
| Bills and gold | 11.50% | +0.6% | +0.1 |
| Portfolio | 100.00% | −31.8% | −31.8 |
| SPY | −18.2% | ||
| QQQ | −32.6% |
At today’s weights the book would have lost about 32% in 2022, in line with QQQ and 14 points more than SPY. Without the two proxies, the 12 holdings with a 2022 record lost about 28%. The hyperscalers, which my downside case has falling 19% over two years, fell 52% as a group that year. 2022 was a rate shock with slowing advertising and e-commerce growth, not a capex pause, so it is a different scenario, but it is the clearest evidence I have that my −27% guide to a peak loss is too small. I have not yet tested the book in the 2025 tariff drawdown or with rolling correlations.
The financing-dependent holding adds a separate risk. Nebius funds growth partly with customer prepayments and convertible notes [11][25]. If equity markets close to builders, those plans slow down, and the stocks fall before the businesses do. SpaceX carries a different supply risk: up to 328.4 million shares became eligible for sale on September 24 as IPO lockups expired [43], and Elon Musk holds most of the voting power [48].
Signposts
I review these at each earnings season and whenever a threshold is crossed. The first read on most of them is the third-quarter prints in late October.
| Claim | Where it stands | Supports the thesis | Breaks the thesis |
|---|---|---|---|
| Building to earning | AWS +37% and Google Cloud +82% in Q2 [6][9] | AWS growth at or above 25% and Google Cloud at or above 35% while capex growth slows | Combined 2027 capex guide rises while cloud growth slows |
| Meta converts | Operating income −8% in Q2, about +9% before legal and severance charges [5] | Operating income grows again in 2027; Muse shows a path to paid revenue | Operating income still falling through 2027, or 2027 capex guidance rises in January with no Muse revenue disclosed |
| Scarce inputs | Nebius guides to $7B to $9B of run-rate revenue by year-end [38]; GPU prices raised 17% to 21% [12] | Nebius reaches year-end run-rate revenue of $7B or more; new long-term power contracts keep signing | GPU rental prices fall at renewal, or ERCOT forwards keep falling |
| Agents reprice software | Subscription revenue +23% in constant currency; current RPO +21% [17] | ServiceNow organic growth at or above 18%; current RPO growing at least as fast as revenue | Organic growth below 16% while gross margin keeps falling |
| Cost of capital | 10-year at 4.96% on Sep 22, touched 5.135% on Sep 23 [23][24] | 10-year back inside 4.5% to 5% | 10-year above 5.5% on a sustained basis |
| Policy | Chip index fell 5.8% on Sep 14; Nasdaq at a record by Sep 22 [31][32] | AI policy headlines keep reversing within weeks | A binding limit on frontier AI, or card-fee legislation passing either chamber |
| Independent sleeve | MercadoLibre operating margin 6.7% in Q2 [35] | Mastercard and UnitedHealth hold up in the next drawdown; MercadoLibre margin rising from 6.7% | MercadoLibre margin still falling by mid-2027 |
| Reserves | No trigger; Nasdaq at a record on Sep 22 [32] | SGOV deploys on a 10% or 20% QQQ drawdown | SGOV sits unused through a QQQ drawdown of more than 15% |
Conclusion
Three things have to happen over the next two years for this book to work. AWS and Google Cloud have to keep growing faster than their depreciation, so that $1 trillion of combined backlog becomes operating income in 2027 and free cash flow by 2028. Meta has to turn its spending into operating income growth before its 2027 capex guidance lands. And the 10-year yield has to settle back inside 4.5% to 5%, because every half point above that costs about 4 to 5 points of expected return even if the rest of the thesis is right.
I am confident that AI demand is real. The backlogs are too large to explain any other way, even allowing that part of them rests on AI labs that are still raising the money to pay. What I cannot know yet is whether the returns reach the shareholders of these specific companies before depreciation and the cost of capital catch up. The signposts above are how I will find out, and I will publish the results each quarter, including the ones that go against me.
Sources
Citation numbers in the text link here.
- [1]Toffel Capital, Investments (weights, snapshot as of Sep 25, 2026) and Performance (data through Sep 25, 2026). https://toffelcapital.com/portfolio/investments https://toffelcapital.com/performance
- [2]StockAnalysis.com, closing prices, market capitalization, forward P/E, five-year beta, dividend yield and trailing revenue growth for all holdings, Sep 23, 2026 close. https://stockanalysis.com/
- [3]CNBC, Amazon Q2 2026 results and call (capex, backlog, capacity), Jul 30, 2026. https://www.cnbc.com/2026/07/30/amazon-amzn-q2-earnings-report-2026.html
- [4]CNBC, Alphabet Q2 2026 results (capex guidance), Jul 22, 2026. https://www.cnbc.com/2026/07/22/google-earnings-q2-goog-live-updates.html
- [5]Meta Platforms, Q2 2026 results (SEC Form 8-K, Exhibit 99.1), Jul 29, 2026. https://www.sec.gov/Archives/edgar/data/0001326801/000162828026050596/meta-06302026xexhibit991.htm
- [6]Amazon, Q2 2026 results, Jul 30, 2026. https://www.businesswire.com/news/home/20260729379483/en/Amazon.com-Announces-Second-Quarter-Results
- [7]Alphabet, Q2 2026 earnings call, Jul 22, 2026. https://abc.xyz/investor/events/event-details/2026/2026-Q2-Earnings-Call-2026-GgTAq7Is0z/default.aspx
- [8]Amazon, Q1 2026 earnings call transcript (Motley Fool), Apr 29, 2026. https://www.fool.com/earnings/call-transcripts/2026/04/29/amazon-amzn-q1-2026-earnings-call-transcript/
- [9]Alphabet, Q2 2026 results (SEC Form 8-K, Exhibit 99.1), Jul 22, 2026. https://www.sec.gov/Archives/edgar/data/1652044/000165204426000066/googexhibit991q22026.htm
- [10]Meta Platforms, Q2 2025 results, Jul 30, 2025. https://investor.atmeta.com/investor-news/press-release-details/2025/Meta-Reports-Second-Quarter-2025-Results/default.aspx
- [11]Nebius Group, Q2 2026 earnings call transcript (Motley Fool), Aug 19, 2026. https://www.fool.com/earnings/call-transcripts/2026/08/19/nebius-nbis-q2-2026-earnings-call-transcript/
- [12]Reuters, Nebius raises AI cloud prices again, Sep 17, 2026. https://www.reuters.com/technology/nebius-hikes-ai-cloud-prices-again-demand-computing-power-soars-2026-09-17/
- [13]US Department of Energy, LBNL report on data center electricity demand, Dec 20, 2024. https://www.energy.gov/articles/doe-releases-new-report-evaluating-increase-electricity-demand-data-centers
- [14]Constellation Energy, Q2 2026 results, Aug 6, 2026. https://www.businesswire.com/news/home/20260805185047/en/Constellation-Reports-Second-Quarter-2026-Results
- [15]New Era Energy & Digital, Form 8-K describing a 20-year power agreement with Vistra, 2026. https://www.sec.gov/Archives/edgar/data/0002028336/000121390026101642/ea0305716-8k_newera.htm
- [16]Vistra, Q2 2026 earnings call transcript (Motley Fool), Aug 2026. https://www.fool.com/earnings/call-transcripts/2026/08/14/vistra-vst-q2-2026-earnings-call-transcript/
- [17]ServiceNow, Q2 2026 results (SEC exhibit), Jul 22, 2026. https://www.sec.gov/Archives/edgar/data/1373715/000137371526000072/erq2fy26.htm
- [18]CNN Business, AI stocks slide after calls to slow development, Sep 14, 2026. https://www.cnn.com/2026/09/14/business/ai-stocks-slide-slowdown-development-amodei-altman-intl
- [19]CNBC, Meta’s Muse downloads (Sensor Tower data), Sep 21, 2026. https://www.cnbc.com/2026/09/21/meta-muse-personal-ai-agent-downloads.html
- [20]Reuters via Yahoo Finance, market report including Amazon’s block of Muse, Sep 22, 2026. https://finance.yahoo.com/markets/articles/wall-st-futures-pause-ai-101907090.html
- [21]Federal Reserve, transcript of Chair Warsh’s press conference, Sep 16, 2026. https://www.federalreserve.gov/mediacenter/files/FOMCpresconf20260916.pdf
- [22]CNBC, 10-year Treasury yield rises to highest since 2007, Sep 15, 2026. https://www.cnbc.com/2026/09/15/10-year-treasury-yield-rises-to-highest-since-2007.html
- [23]US Department of the Treasury, daily par yield curve rates, 2026. https://home.treasury.gov/resource-center/data-chart-center/interest-rates/TextView?type=daily_treasury_yield_curve&field_tdr_date_value=2026
- [24]CNBC, stock market live updates, Sep 23, 2026. https://www.cnbc.com/amp/2026/09/22/stock-market-today-live-updates.html
- [25]Nebius Group, closing of convertible senior notes offering (Business Wire), Aug 24, 2026. https://www.businesswire.com/news/home/20260824987558/en/Nebius-Group-announces-closing-of-private-offering-of-convertible-senior-notes-with-aggregate-gross-proceeds-of-approximately-5.75-billion/
- [26]US Bureau of Labor Statistics, Consumer Price Index news release for August 2026, Sep 11, 2026. https://www.bls.gov/news.release/cpi.nr0.htm
- [27]CNBC (Reuters), gold nears $5,600, Jan 29, 2026. https://www.cnbc.com/2026/01/29/gold-nears-5600-as-safe-haven-rush-intensifies-silver-blazes-past-120.html
- [28]Bloomberg, gold’s choppy session after record, Jan 2026. https://www.bloomberg.com/news/articles/2026-01-29/gold-resumes-rally-after-dropping-on-thursday-in-choppy-session
- [29]Federal Reserve Bank of St. Louis, FRED Blog, September 2026 Summary of Economic Projections. https://fredblog.stlouisfed.org/2026/09/fomc-summary-of-economic-projections-september-2026/
- [30]Dario Amodei, “We Must Pace the Frontier,” essay, Sep 12, 2026, and CoinDesk coverage of the Altman and Musk endorsements. https://darioamodei.com https://www.coindesk.com/tech/2026/09/12/anthropic-ceo-calls-for-ai-race-to-slow-down-musk-and-openai-s-altman-agrees
- [31]NBC News, stocks fall after AI leaders’ warning, Sep 14, 2026. https://www.nbcnews.com/business/markets/stocks-tumble-ai-leaders-warning-slowdown-ipos-amodei-altman-rcna597643
- [32]Reuters via News Tribune, Nasdaq notches record high close, Sep 22, 2026. https://www.newstribune.com/news/2026/sep/22/nasdaq-notches-record-high-close-ai-optimism/
- [33]KFF, preliminary 2027 ACA marketplace rate filings, Jul 13, 2026. https://www.kff.org/affordable-care-act/in-preliminary-rate-filings-aca-marketplace-insurers-largely-propose-double-digit-premium-increase-for-2027-following-a-steep-climb-this-year/
- [34]PYMNTS, Credit Card Competition Act gains Senate support, Aug 11, 2026. https://www.pymnts.com/credit-cards/2026/credit-card-competition-act-gains-new-senate-support/
- [35]MercadoLibre, Q2 2026 results (SEC exhibit), Aug 5, 2026. https://www.sec.gov/Archives/edgar/data/0001099590/000109959026000021/meli-20260805xex991.htm
- [36]Mastercard, Q2 2026 results (SEC exhibit), Jul 30, 2026. https://www.sec.gov/Archives/edgar/data/0001141391/000114139126000081/ma06302026-exx991xearnings.htm
- [37]UnitedHealth Group, Q2 2026 results, Jul 16, 2026. https://www.unitedhealthgroup.com/newsroom/2026/2026-07-16-uhg-reports-second-quarter-2026-results.html
- [38]Nebius Group, Q2 2026 shareholder letter, Aug 12, 2026. https://assets.nebius.com/assets/a6ecfd85-a6cb-4967-8ef7-9a25bd261f9c/SHLQ226.pdf
- [39]StockAnalysis.com, SpaceX (SPCX) overview and statistics: market cap, trailing revenue and net loss, forward P/E, cash and debt, retrieved Sep 24, 2026. https://stockanalysis.com/stocks/spcx/
- [40]NVIDIA, second quarter fiscal 2027 results (SEC Form 8-K), Aug 26, 2026. https://www.sec.gov/Archives/edgar/data/0001045810/000104581026000073/q2fy27pr.htm
- [41]VanEck, SMH fund page (daily holdings), Sep 24, 2026. https://www.vaneck.com/us/en/investments/semiconductor-etf-smh/
- [42]FinanceCharts, 2022 total returns for SPY, QQQ and each holding in the 2022 replay, retrieved Sep 27, 2026. https://www.financecharts.com/etfs/SPY/performance/total-return
- [43]Benzinga, SpaceX stock slides on insider sale and lockup expiration, Sep 23, 2026. https://www.benzinga.com/trading-ideas/movers/26/09/61958875/spacex-stock-slides-wednesday-what-happened
- [44]Toffel Capital, Decision Log, entries through Sep 24, 2026. https://toffelcapital.com/decision-log
- [45]FactSet, Earnings Insight (forward 12-month P/E of 21.3 at Dec 31, 2021), Apr 1, 2022. https://advantage.factset.com/hubfs/Website/Resources%20Section/Research%20Desk/Earnings%20Insight/EarningsInsight_040122B.pdf
- [46]FactSet, S&P 500 Earnings Season Update (forward 12-month P/E of 16.7 at Dec 31, 2022), Jan 20, 2023. https://insight.factset.com/sp-500-earnings-season-update-january-20-2023
- [47]Zacks Investment Research, 10-year Treasury yield at year-end 2021 and 2022 (Federal Reserve data), 2023. https://www.zacks.com/commentary/2128143/all-eyes-on-the-fed-final-hike-of-the-cycle
- [48]SpaceX, Form S-1 registration statement (business, AI segment and voting structure), filed May 20, 2026. https://www.sec.gov/Archives/edgar/data/1181412/000162828026036936/spaceexplorationtechnologi.htm
For informational purposes only. Not financial advice.
Some chart values exist only as unlabelled bars in the printed figures and are not reproduced in text here (figures on pages 2, 7, 11). The PDF edition shows them as printed.